Tuesday, March 28, 2023
Thursday, September 22, 2022
Tableau - A Data Blending Example
As to handle data sources inside it, Tableau provides a bunch of means to process them, such as join, union, relationships, blending and etc. Relationships was newly introduced in the late version, Tableau 2020.2, which builds a logical layer on data source. Since it is not the topic for this post, so let's skip it at this point. Data blending is particularly useful when you use two data sources that have different level of detail in the same view. Let's save words and get down to work now.
In this example, we will explore the sales performance by comparing actual sales against goals by branch. The primary data source is the actual sales by representative. The secondary data source defines the sales goal by branch. They share Region, Branch Code, Branch, Fiscal Year attributes, as shown in the below screenshots.

(the primary data source: Sales (datasource))

(the secondary data source: Goal (datasource))
Now, let's define the blending relationship for the above data sources. After you select the [Goal (datasource)] as the secondary one, Tableau automatically identified the key fields for blending because they share the same field names.

We drag [Fiscal Year], [Region] and [Branch] from the primary data source to the Rows tab in the view. Then add [Sales] and [Goal] to the Column tab, from the two data source respectively. Choose [bullet graphs] from Show Me menu. Additionally, we add [Product Category] to Color tab and add [Representative] to Detail tab so that the view level of detail is intentionally brought down to the finest level which is same as the primary data source.

It looks like the goals are set too high so only a few branches performed well. Let's take a look at what actually happened behind the scene. Right click on the view and select View Data menu, we can see the blended dataset used for this view.
The goals come to every row when the key fields, [Fiscal Year], [Region], [Branch], match with each other in the blended data sources. We use the first row as an example. The sales goal for branch Aichi is set as 4,800 in 2022. After blended, it appears in every record of the branch's Representatives.
This is how data blending works. You can find the changes when you add or remove the blending key fields.

As a result, the goal of a branch is multiplied by (# of Product Category * # of Representatives) when it is aggregated in the view, which is not the result we expected.
To fix it, we count the duplicates for each branch using a LOD expression, as the diagram shows below.

Then simply divide the sum of Goal by the count of duplicates in the view. The expected result came out as follows.

Monday, September 12, 2022
Monday, September 5, 2022
Make Java to Handle Only Business Logics (4) - How about Using an ETL Process in Place of Spring Boot Batch?
The below are the employee records associated to the department table via department number.

The department table comes here. Please pay attention to the record with grey background, which is not valid any more as the department's name was changed effective as of Jan. 1, 2011.

The two source tables will be imported and re-organized as the master table shown as below. Retail Sales becomes the new new name of department No. 2, instead of Online Sales.

To fulfill this purpose, I create a job flow as below with one transformation and a mail step. The transformation takes on the major work needed to be done from extract through transform to load. The mail step sends an email to the support team when the process fails due to an unexpected error.
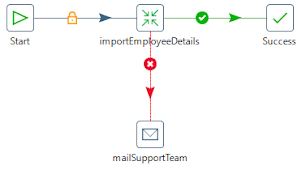
The major part is the transformation which extracts data from [Employee] table and [Department] table, filters out invalid records, joins the two data sets and then loads the clean data into [EmployeeDetails] table.

Spoon provides a graphical interface where you can configure log setting. Double click [importEmployeeDetails] transformation on the job design window and the setting dialog pops up. Go to [Logging] tab and specify a log file as well as the preferable log level.
Here is an example of the log with basic level for the above transformation.

With plenty of in-box functionalities, you can develop an ETL process in a stress-free way to import employee master data into your application. The process is visualized on Spoon and each of steps is visible to you during execution.
Subscribe to:
Posts (Atom)
[Tips] Spring Boot - Check Out Spring MVC through Implementing a Simple Function
Last updated on: When it comes to Spring MVC, the well-known MVC architecture diagram comes to our mind. It helps us underst...

-
Last updated on: Spring JDBC is intuitive: you issue a query, and you get a dataset; when you extract the data from the ResultSet and...
-
 As to handle data sources inside it, Tableau provides a bunch of means to process them, such as join, union, relationships, blending and e...

