Pivoting is a very useful technique in data analytics, which transforms rows into columns. On the contrary, unpivoting operation brings columns to rows. If you are familiar with pivot table in Excel, you can simply see this as a implementation at database level. Tableau also incorporates this technique into its data source layer.
Pivoting works as shown by the diagram below.
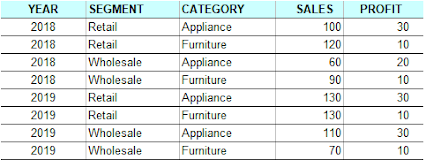
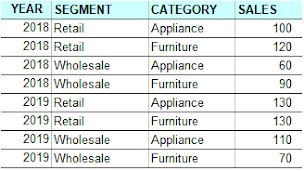
I am going to demonstrate them in the following sections by using the below data example, a view named by SALES_VIEW.
1. Pivoting on a Single Column
Let's rotate column SEGMENT into rows in this pivoting operation.
SELECT * FROM (SELECTYEAR,SEGMENT,CATEGORY
, SALESFROM SALES_VIEW) S PIVOT (SUM(SALES)FOR SEGMENT IN ('RETAIL' AS RETAIL_SALES,'WHOLESALE' AS WHOLESALE_SALES))ORDER BYYEAR,CATEGORY;
2. Pivoting on Multiple Columns
Then let's try 2 columns this time, SEGMENT and CATEGORY.
SELECT * FROM (SELECTYEAR,SEGMENT,CATEGORY
, SALESFROM SALES_VIEW) S PIVOT (SUM(SALES)FOR (SEGMENT, CATEGORY) IN (('Retail' , 'Appliance') AS RETAIL_APPLIANCE_SALES,('Retail' , 'Furniture') AS RETAIL_FURNITURE_SALES,('Wholesale', 'Appliance') AS WHOLESALE_APPLIANCE_SALES,('Wholesale', 'Furniture') AS WHOLESALE_FURNITURE_SALES ))ORDER BYYEAR
;
All fact data on rows go to columns.
3. Unpivoting on Multiple Columns
To practice this, let's create a view, PIVOTEDVIEW, having the same data structure as the pivoted result in section "2. Pivoting on Multiple Columns".
Using the below statement to unpivot in on columns SEGMENT and CATEGORY, we will get the data set as SALES_VIEW shows.
SELECTYEAR,SEGMENT,CATEGORY,SALESFROM PIVOTEDVIEWUNPIVOT INCLUDE NULLS(SALESFOR (SEGMENT, CATEGORY)IN(RETAIL_APPLIANCE_SALES AS ('Retail', 'Appliance'),RETAIL_FURNITURE_SALES AS ('Retail', 'Furniture'),WHOLESALE_APPLIANCE_SALES AS ('Wholesale', 'Appliance'),WHOLESALE_FURNITURE_SALES AS ('Wholesale', 'Furniture')))ORDER BYYEAR,SEGMENT,CATEGORY;
4. How about Multiple Aggregates?
In some cases you want to pivot or unpivot more than one aggregates, this is also doable in Oracle. We use SALES_VIEW as the source data for our demo, and pivot with SALES and PROFIT.
SELECT*FROM (SELECTYEAR,SEGMENT,CATEGORY,SALES,PROFITFROMSALES_VIEW) SPIVOT (SUM(SALES) AS SALES, SUM(PROFIT) AS PROFITFOR SEGMENTIN ('Retail' AS RETAIL,'Wholesale' AS WHOLESALE))ORDER BYYEAR,CATEGORY;
Let's use unpivoting to restore the above data set to its original state, saying, SALES_VIEW. Assume that we've created a view by the name of PIVOTEDVIEW_2SUMS for the above data set. Here is the unpivot statement.
SELECTYEAR,SEGMENT,CATEGORY,SALES,PROFITFROM PIVOTEDVIEW_2SUMSUNPIVOT INCLUDE NULLS((SALES, PROFIT)FOR SEGMENTIN((RETAIL_SALES , RETAIL_PROFIT) AS 'Retail',(WHOLESALE_SALES, WHOLESALE_PROFIT) AS 'Wholesale'))ORDER BYYEAR,SEGMENT,CATEGORY;


No comments:
Post a Comment